
Welcome to aequumAI
Quantifying Inequity to Inspire Collective Action
Why Choose aequumAI?
We measure and visualize socioeconomic disparities, empowering communities and policymakers to build a fairer society.
Equity Focused
Our mission is to identify and quantify disparities in homeownership, income, and beyond.
New York State Insights
We combine upstate real estate data, NYC tax records, and FEMA datasets for a holistic look at property equity.
Predictive Modeling
Our patent-pending approach fills missing race data and bounds errors, ensuring reliable, actionable insights.

About aequumAI
Our journey from research at the Social Security Administration to real-world analytics solutions.
-
Our Story
We spent four years developing race-modeling at the Social Security Administration producing multiple research papers. Building on this expertise, we founded aequumAI to combine our refined methods with real-world data sets—starting with comprehensive NY State real estate records.
-
Our Approach
- Robust Race Prediction: We leverage neural networks and large language models (LLMs) to estimate race where data is missing.
- Patent-Pending Error Bounding: Our process quantifies misclassification risks, providing confidence intervals for policy decisions.
- Transparent Reporting: Through dashboards and in-depth visualizations, we make it easy to identify disparities—without burying the complexity.
-
Our Mission
Our aim is not just to reveal inequality, but to help communities, stakeholders, and policymakers address it with data-driven solutions. We believe that by making inequities visible we can galvanize broader buy-in for solutions.
Data & Analytics - New York Case Study
Broad dataset integration experience including Census, American Community Survey (ACS), FEMA, state voter data, and state property data - all analyzed and integrated into geomappings.
Our Key Datasets
NY Upstate Real Estate
Comprehensive records of property assessments and ownership data across Upstate New York. Useful for analyzing home ownership trends, valuation, and taxation equity.
NYC Real Estate & Tax Records
Millions of property valuation, owner, and address records spanning the five boroughs—ideal for deep dives into urban property disparities and ownership trends.
NY FEMA Data
Structure-level info—construction type, heating, sewer—enabling resilience and climate-related equity studies, particularly in vulnerable communities.
Census & ACS
Rich demographic data, income levels, population proportions, and more—for constructing fair baselines in equity analyses.
Predictive Modeling
Our patent-pending approach fills missing race data and bounds errors, ensuring reliable, actionable insights in high-
Analytical Approach
We integrate these datasets at the census-tract level, applying our AI models to predict race where missing.
By comparing predicted ownership (or transaction rates) to local census demographics, we highlight
over- or under-representation in other areas such as:
- Property Tax Burdens
- Home Ownership vs. Income Levels
- Corporate vs. Individual Ownership
- Health insurance claims
- Loan approval rates
- Student acceptance rates
Case Study: Home Ownership by race in New York State
Leveraging New York-focused datasets for actionable insights.
We obtained New York Sate and City tax records that included names and addresses that we used to predict race using our proprietary race prediction models plus real estate value data to estimate the value owned by race in given Census tracts. We then compared the estimated ownership percentages with the census reported percentages for comparison. Below are two results, one for White vs Hispanic based on income and the second is White versus African American based on local race percentages published by Census.We segmented the NY dataset by owner types, Corporate, Trust, Public, and Individual owned. Below we show the results compared for individual ownership with the results for when corporate ownership is included in the analysis.
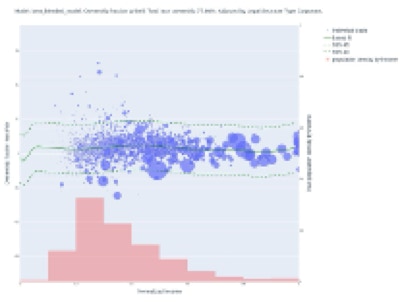
Who Owns What: Income Analysis (White & Hispanic)
We compared each group’s ownership share against a fair baseline based on local demographics, plotting Normalized Income (x-axis) vs. “Ownership minus Fair Share” (y-axis).- White Owners: Individuals only: ~85.30% ownership overall. Overrepresented in most low-income tracts, near parity in higher-income areas.
- With corporate included: ~77.60% ownership. Overrepresentation decreases but remains in lower-income tracts.
- Hispanic Owners: Individuals only: ~5.29% ownership. Underrepresented across the income spectrum, especially in low-income tracts.
- With corporate included: ~4.81% ownership. Underrepresentation persists, with deeper gaps in lower-income areas.
Key Takeaways:
- White owners show higher-than-fair shares in low-income tracts; Hispanic owners face notable underrepresentation there.
- Corporate adjustment lowers total ownership for both groups but does not eliminate over-/under-representation.
- Potential need for targeted policy around taxation, lending, or supportive programs to foster equitable homeownership.
White vs. Hispanic Ownership Gaps

NY State Case Overview: Hispanic
Tool Demo: Hispanic
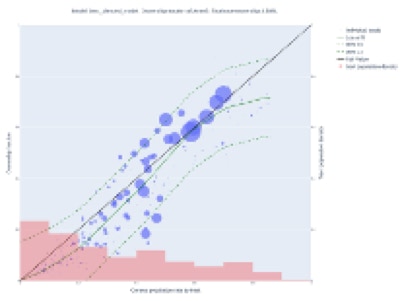
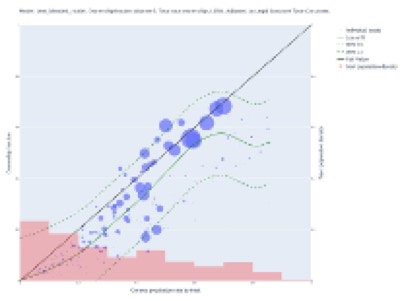
Who Owns What: Racial Analysis (White & African American)
We examined homeownership fractions by race, comparing actual ownership (predicted) to local population share. We generated two sets of charts—one for individual owners, one adjusting for corporate owners.
- White Ownership: Individuals only: ~85.29% total White ownership, generally above the diagonal (overrepresented).
- Including corporate: Drops to ~77.55%, but still above parity in many tracts.
- Black (African American) Ownership: Individuals only: ~2.58% total, mostly below the diagonal (underrepresented).
- With corporate: Further decreases to ~2.35%, deepening the gap from local population share.
Implications:
- White owners remain overrepresented; Black owners remain underrepresented—even after corporate adjustments.
- Corporate ownership is not distributed evenly by race, shifting overall rates differently for each group.
- Accurate accounting of who owns what—including corporate parcels—helps guide equitable tax and housing policy.
Sample Visualization: White vs. Black Ownership Gaps
NY State Case Overview: African American
Tool Demo: African American
Meet the Team
A dedicated group of data scientists, policy experts, and engineers united by a passion for equity.

Terry Leitch
FounderFormer SSA race-modeling lead with four years' experience researching equitable analytics. Passionate about data-driven policy.
Andrei Pastor
Chief Technology OfficerExpert in machine learning, neural networks, and error bounding. Oversees integration of large datasets like NY real estate & FEMA records.
Mark Frutig
System ArchitectBackground in public policy with a focus on housing equity. Connects data insights to real-world legislative and community action.
Sanjana Chalavadi
Data ScientistMachine Learning and AI Modeling
Natalie Leitch
Founder CEODesign and architecture
Contact Us
We’d love to hear from you — whether you’re a policymaker, researcher, or an advocate seeking data-driven change.